Overview
R is a powerful programming language that is widely used for statistical computing and data analysis. As a marketing analyst, you can use R to perform tasks such as data manipulation, data visualization, text mining and more. Its vast library of packages allows for effective handling of large datasets and elaborate analyses.
Data Manipulation
Data manipulation packages are vital when it comes to organizing your data so that you can perform your analysis and gain valuable insights. This package is one I load every time I create a new R script because I know chances are I’ll probably be using it for whatever task I am trying to accomplish.
dplyr
dplyr is my most used package and what I predominantly use for my data manipulation, as its capabilities allow me to perform all the tasks I need. The functions I use the most within the package are:
- summarize(): This function calculates summary statistics for groups of data based on the chosen grouping variables. It’s used to calculate totals and averages, but can also calculate any relevant KPI. When summarized, the grouped-by columns and the column created will only be shown.
- mutate(): Very similar to summarize(), mutate() creates new columns or updates existing ones. The only difference is that mutate() will add this column to the data frame, letting you continue to use it.
- filter(): Is self explanatory, as it filters out specific rows which you do not want to include. Being able to isolate certain audiences or events is very useful when trying to identify best performing groups (like ad groups or campaigns).
- group_by(): group_by() is a must use when creating a new column with mutate() because it allows you to group data into specific categories.
- arrange(): Once you have transformed your data to how you want it, you can use arrange() to sort the data to gain insights. A common use for it could be to sort by date, or some value like engagements.
Data Visualization
Data visualizations are extremely important in the analytics field, as they are the best way to see patterns and simplify complex information. Using these visualizations, analysts can present data effectively to others who may not have as much context as they do.
ggplot2
The good thing about creating visuals in R is that the ggplot2 package has almost every visual needed, and is what analysts use 90% of the time. What is also nice is that ggplot2 uses a consistent setup across different types of graphs, so switching visuals is very simple. ggplot2 also allows for a lot of customization in terms of fonts, coloring, positioning of labels, etc., so you can customize your visualization to your liking.
- geom_bar(): This creates a bar chart, which is typically used for comparing totals from multiple groups.
- geom_tile(): Not as common, but this creates a heatmap which can be a useful visual.
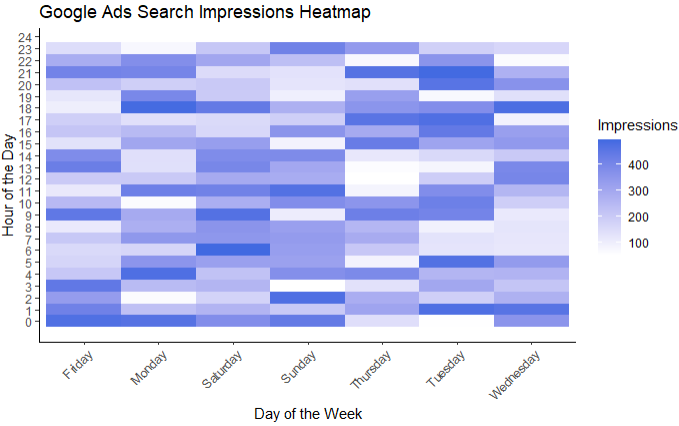
Example of using geom_tile() to create a heatmap with Google Ads Search data.
treemap
As with most processes in R, there are many ways to do the same thing. ggplot2 can be used to create a tree map, but I prefer using the treemap package because it is what I learned first.
- treemap(): Treemaps are a very good alternative to pie charts. They are best used when comparing values relative to the total of those values.
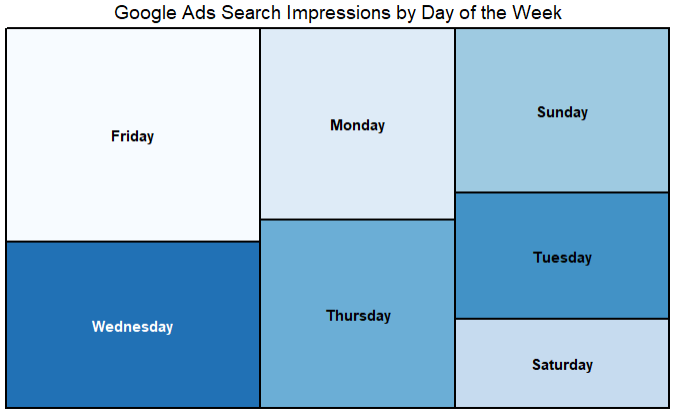
Example of using treemap() to make a treemap with the same Google Ads Search data.
Text Mining
There are a lot of scenarios where you may want to analyze text data, whether that be customer reviews or survey responses. In these scenarios, having a tool that helps you extract patterns and key phrases will allow you to track trends and discover actionable insights.
tidytext
One package I like is tidytext, which allows you to split large text strings into words or phrases. From there, you can work with the functions from the dplyr package to gain insights, like the most used phrases or words.
- unnest_tokens(): This is a function that allows you to extract single words or grouped words from text strings. You can choose how many words you want to be grouped together to find common phrases.
Bonus
If you or your company uses Google Analytics 4 (GA4), then this package can be very useful to you, as it allows you to pull data directly from GA4.
GoogleAnalyticsR
GoogleAnalyticsR lets you interact with the Google Analytics APIs. This can be beneficial for many reasons and allows you to do your own analysis. GA4 has a lot of very good metrics that it creates for you, but looking at this data in R can allow you to make more customized metrics and run different analyses.
Conclusion
Data manipulation, visualization, and text mining are crucial components for any marketing analyst using R. These capabilities help organize data, reveal patterns, and extract key insights from textual data. By integrating R into our analytical processes at Élan, we have been able to enhance our data analysis capabilities. R’s statistical functions and data visualization tools have improved our ability to make data driven insights from complex datasets, and streamline these processes to better our efficiency.